Incidents and referrals
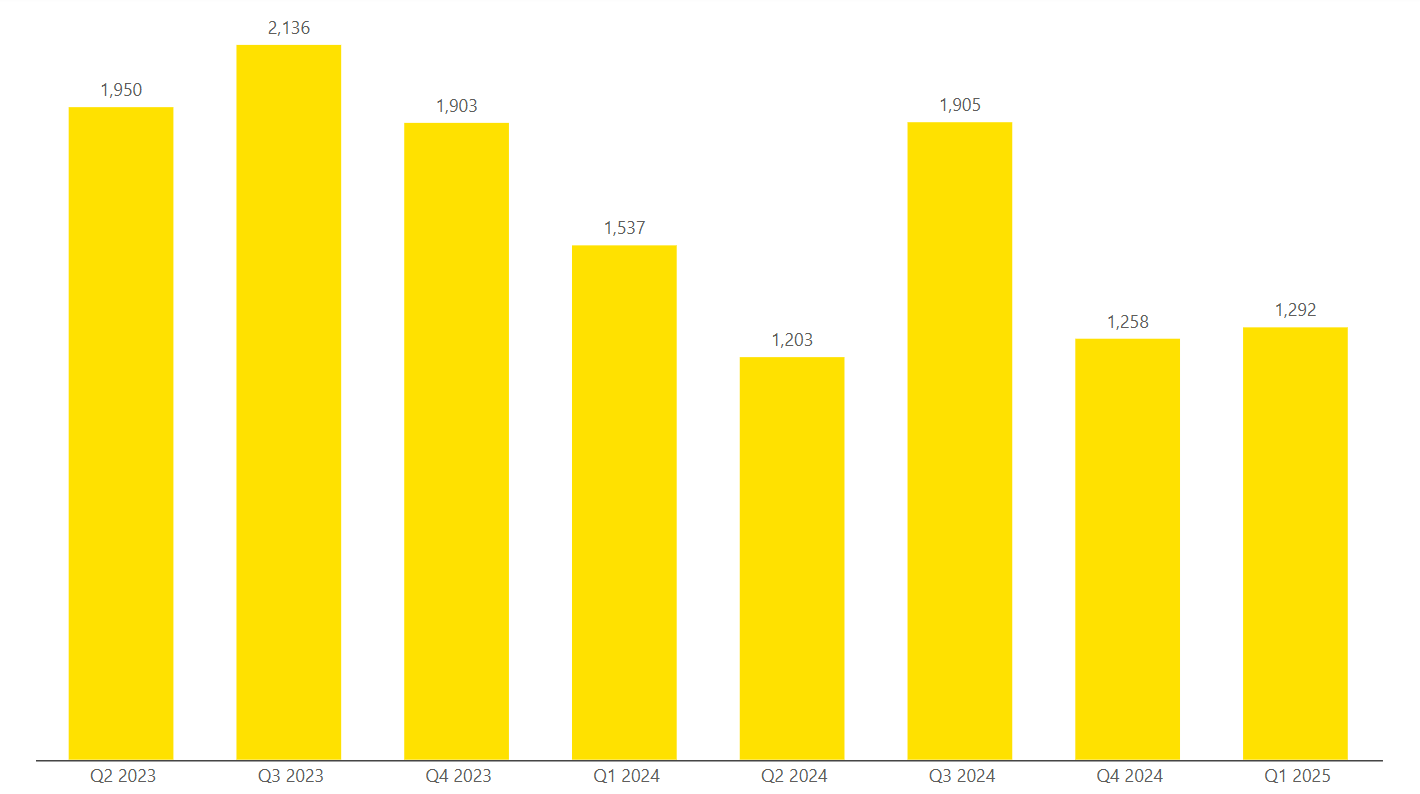
Between 1 January and 31 March 2025, a total of 1,292 incidents were handled through the NCSC's general triage process.
Of these:
• 669 were responded to directly by NCSC
• 472 were referred to New Zealand Police
• 81 were referred to the New Zealand Telecommunications Forum (TCF)
• 74 were referred to the Department of Internal Affairs (DIA)
• 10 were referred to the Commerce Commission
• 5 were referred to Consumer Protection NZ
• 3 were referred to the Office of the Privacy Commissioner (OPC)
• 3 were referred to the Financial Markets Authority (FMA)
• 2 were referred to the Domain Name Commission (DNC)
The NCSC may refer a single incident to multiple agencies. As such, the above referral numbers may not sum to the total incident count.
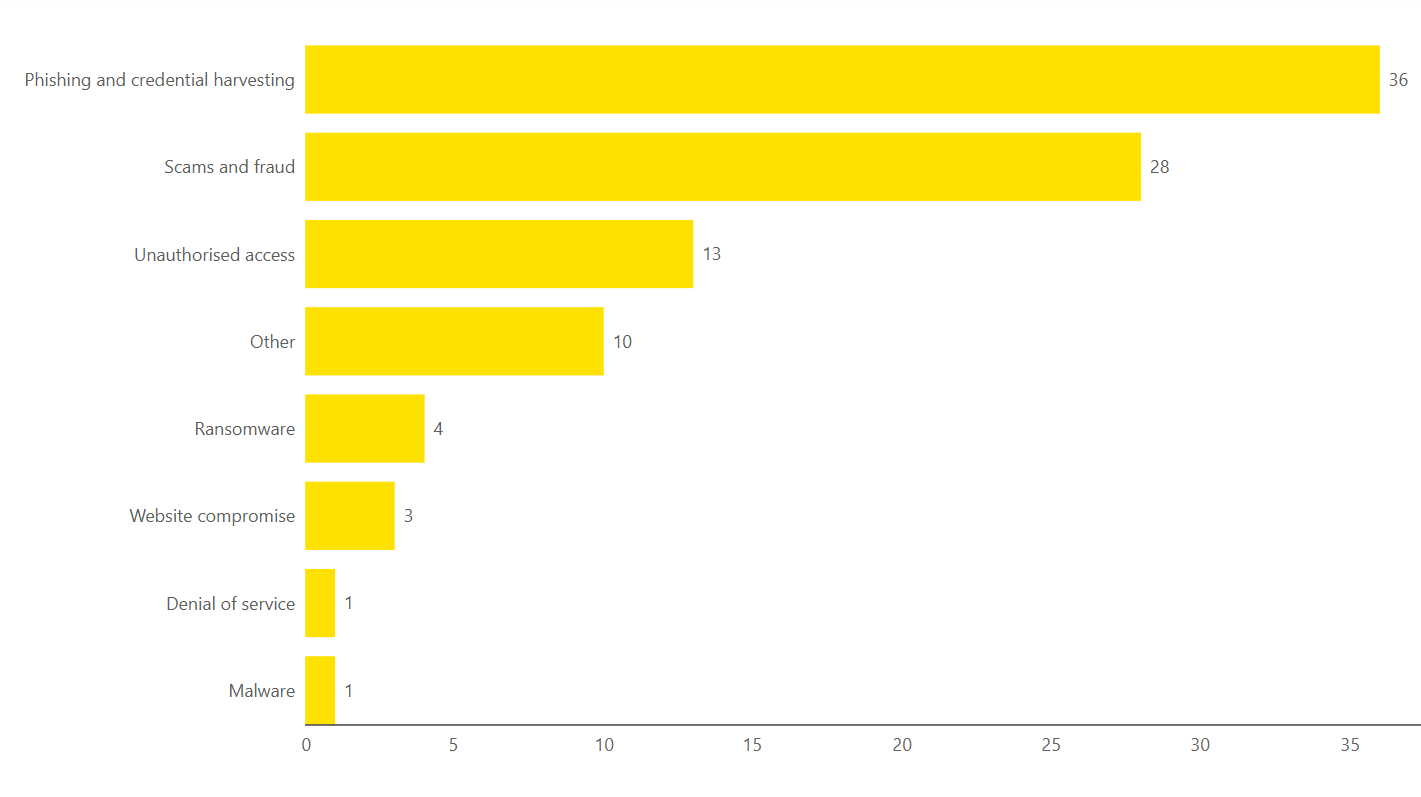
Breakdown by category
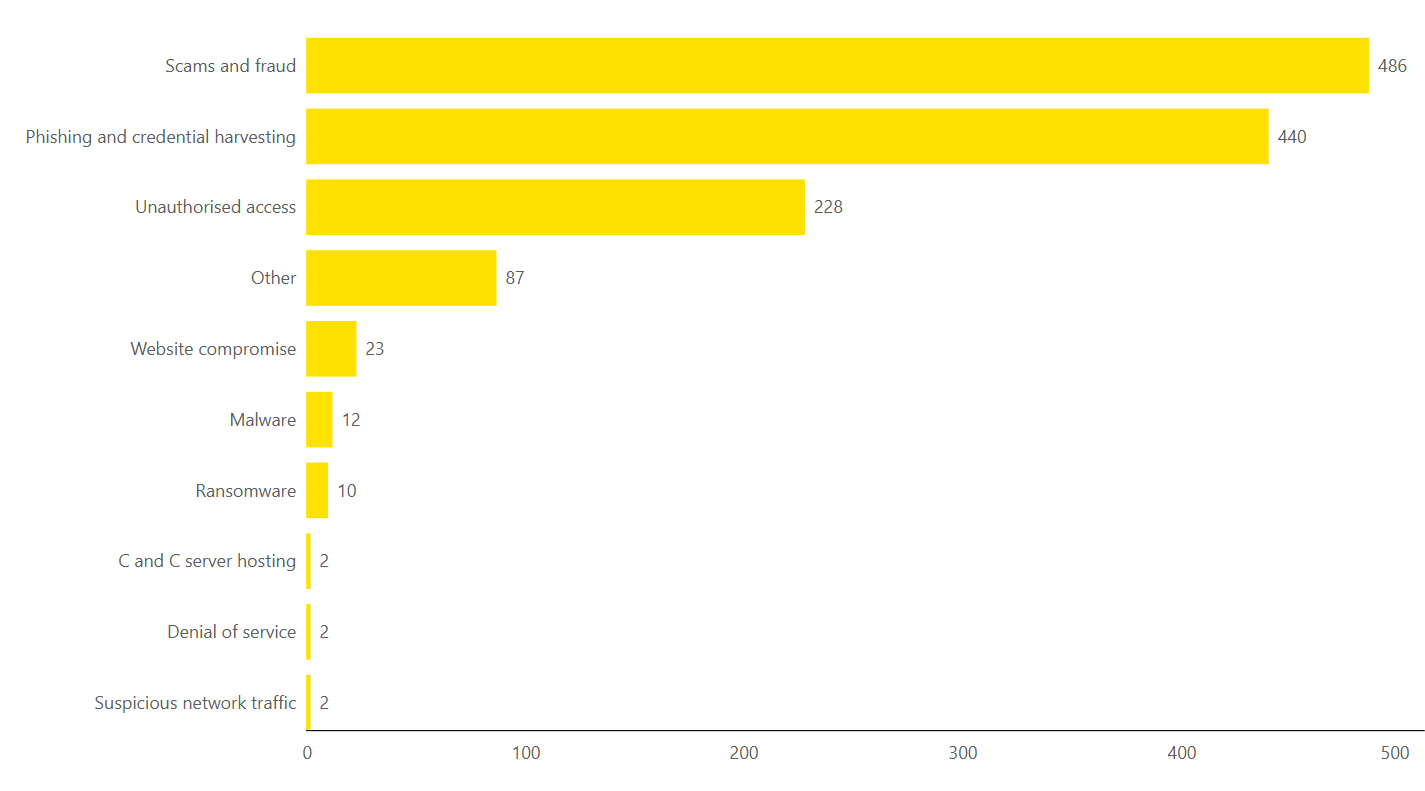
Most categories reported haven't seen significant change from Q4 to Q1. In Q4, Scams and Fraud became the most common incident category for the first time since 2020, and continues to be the most common in Q1. We saw significant increases in Phishing and Credential Harvesting, going from 381 in Q4 to 440 in Q1 (15% increase). Website Compromise reports halved from 46 in Q4 to 23 in Q1.
We define all the incident categories in the appendix of this report - more about the incident categories we use.
Breakdown of Scam and Fraud incidents
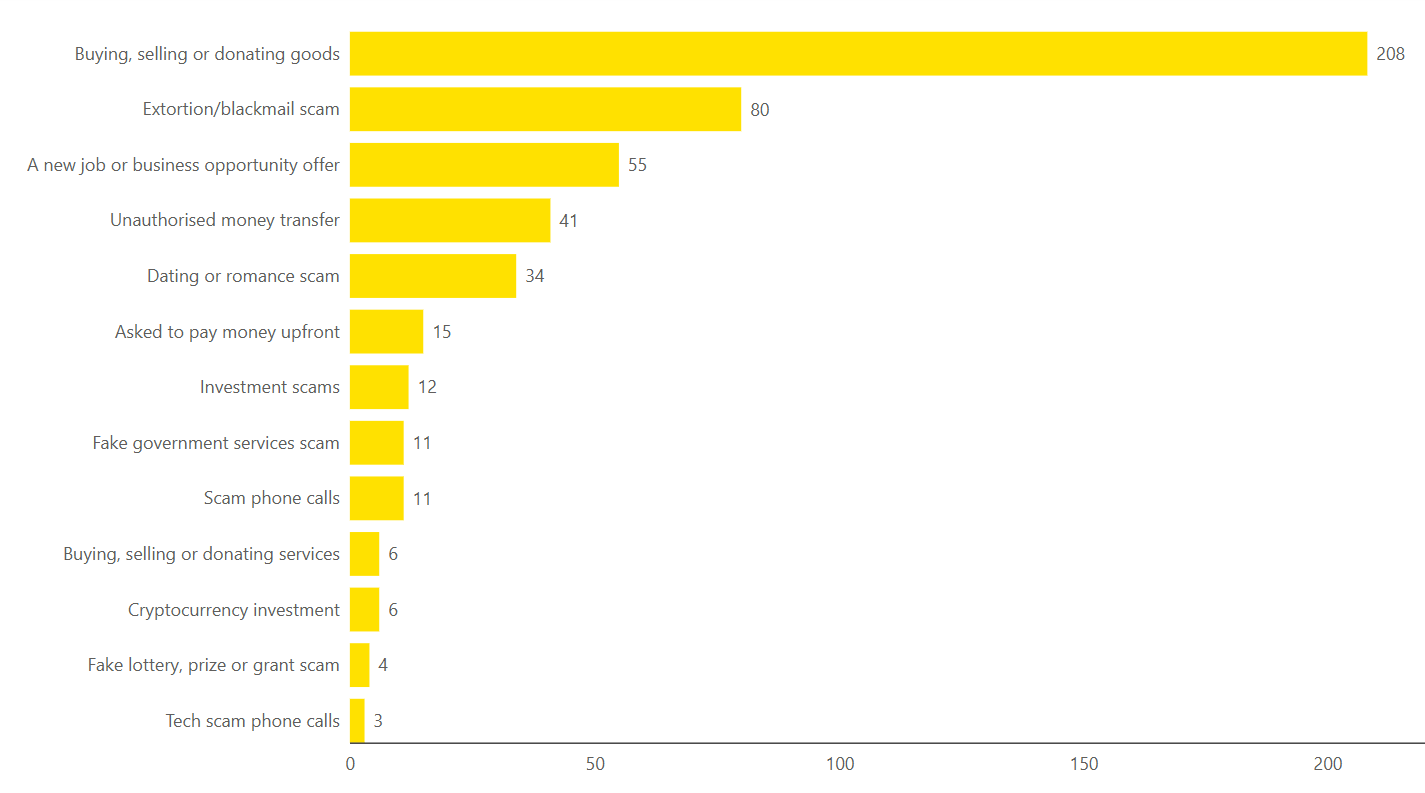
Scams and fraud usually rely on deceiving people, rather than gaining access to a system. Of the incidents responded to NCSC during Q1 2024, 486 (38%) were about Scams and Fraud. This incident category consistently features in the top three reported but is the most common category for Q1.
During Q1, NCSC received 208 reports on scams involving Buying, Selling or Donating Goods, a 19% decrease from 256 in Q4. Incidents relating to Extortion increased from 75 in Q4 to 80 in Q1 (7% increase), many of these relating to the mass email campaigns discussed last quarter. Dating and Romance scams increased from last quarter, from 28 to 34 (21% increase).
Incidents affecting individuals
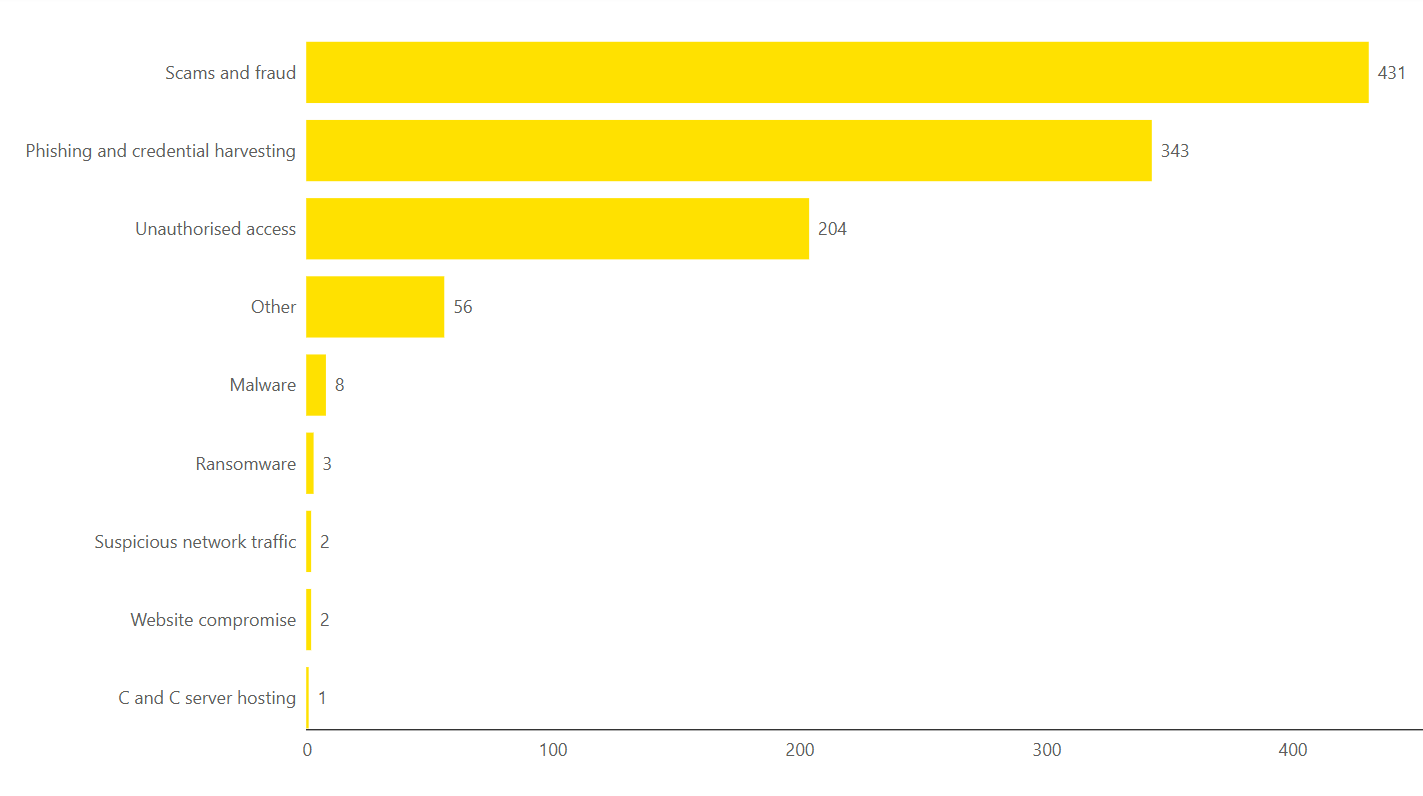
In Q1 2025, 1,050 (81%) incidents were reported as affecting individuals.
The largest category affecting individuals this quarter is Scams and Fraud, which accounts for nearly half (41%) of the individual reports. The number of Unauthorised Access incidents reported by individuals increased from 176 in Q4 to 204 in Q1 (16% increase).
Incidents affecting organisations
In Q1 2025, 97 (7%) incidents triaged by the NCSC for general support specified that they affected organisations.
Phishing and Credential Harvesting continues to be the largest category of incidents reported to us by organisations, accounting for 60% of incidents affecting organisations during Q1 2025. Scams and Fraud reported by organisations increased this quarter from 18 in Q4 to 28 Q1 (56% increase).
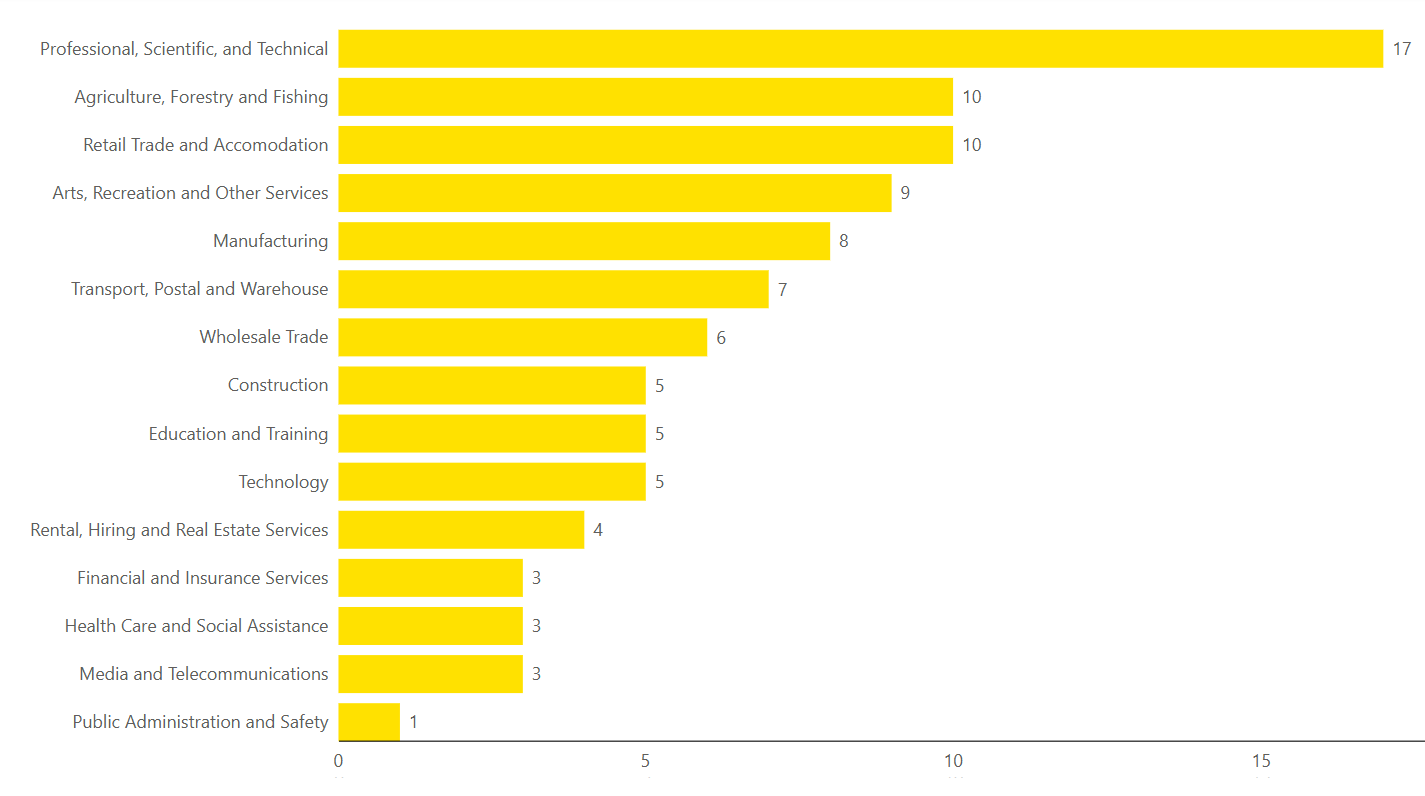
Demographics: Reporting by sector
Professional, Scientific and Technical is the most commonly reported sector this quarter. The number of reports that provided a sector made up 7% of incidents this quarter.
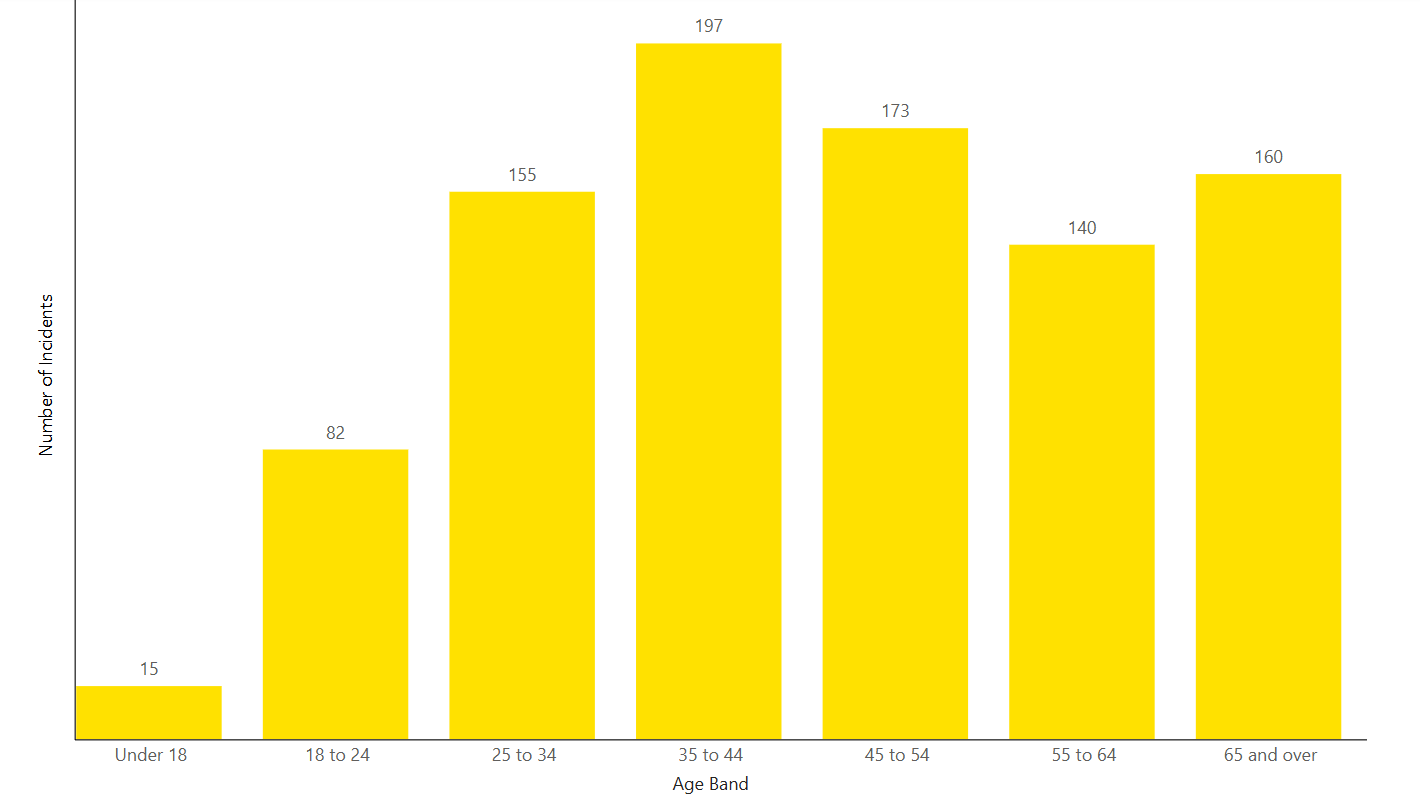
Demographics: Reporting by age
Of the 1,292 incidents reported to the NCSC during Q1, 922 (71%) provided their date of birth.
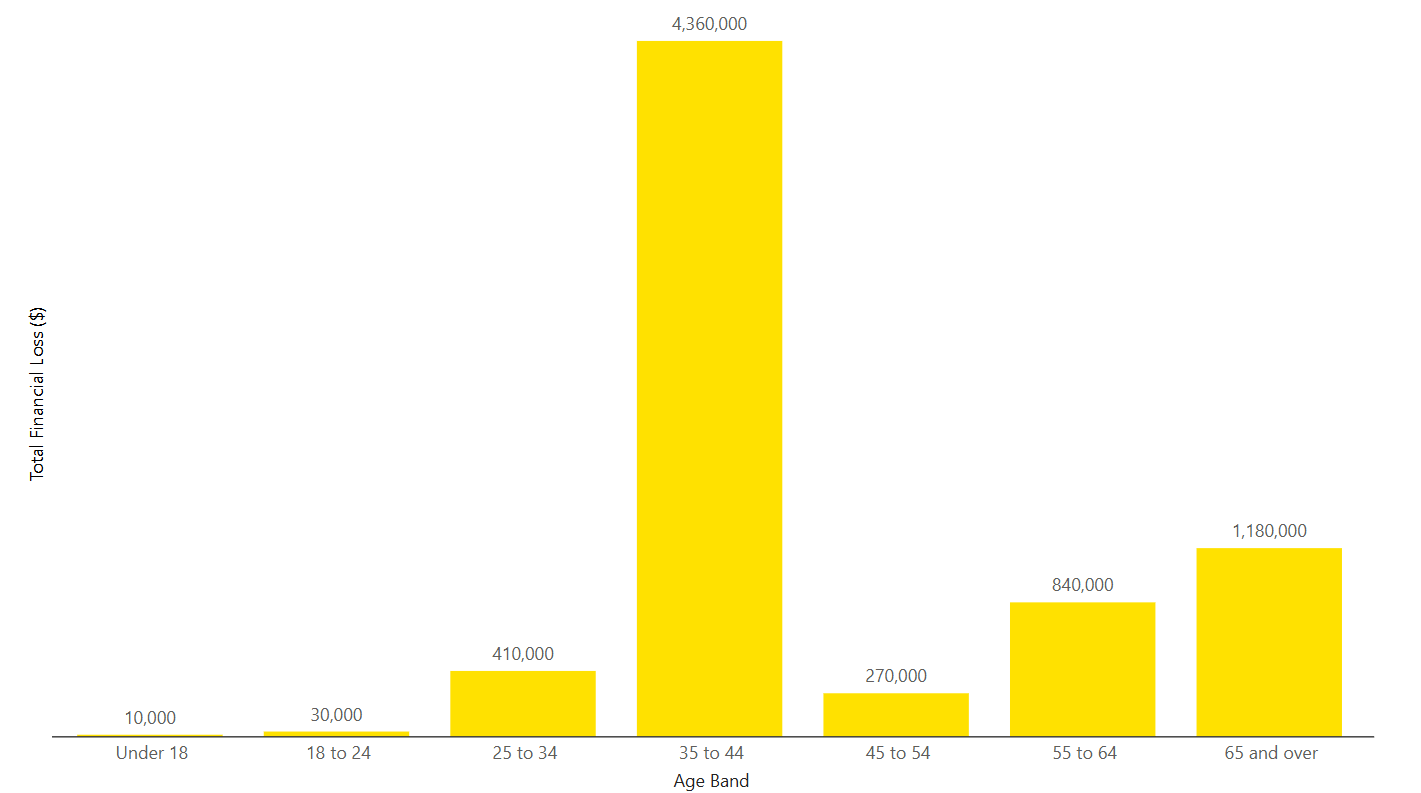
Reporters 45 and over collectively reported 51% of reports that included an age while only accounting for 32% of the loss for such reports. Meanwhile, reporters between 35 and 44 represented 21% of incidents that provided an age but a combined loss of $4.4M (61% of loss for reporters that provided an age).
Incidents affecting individuals – Financial loss by age
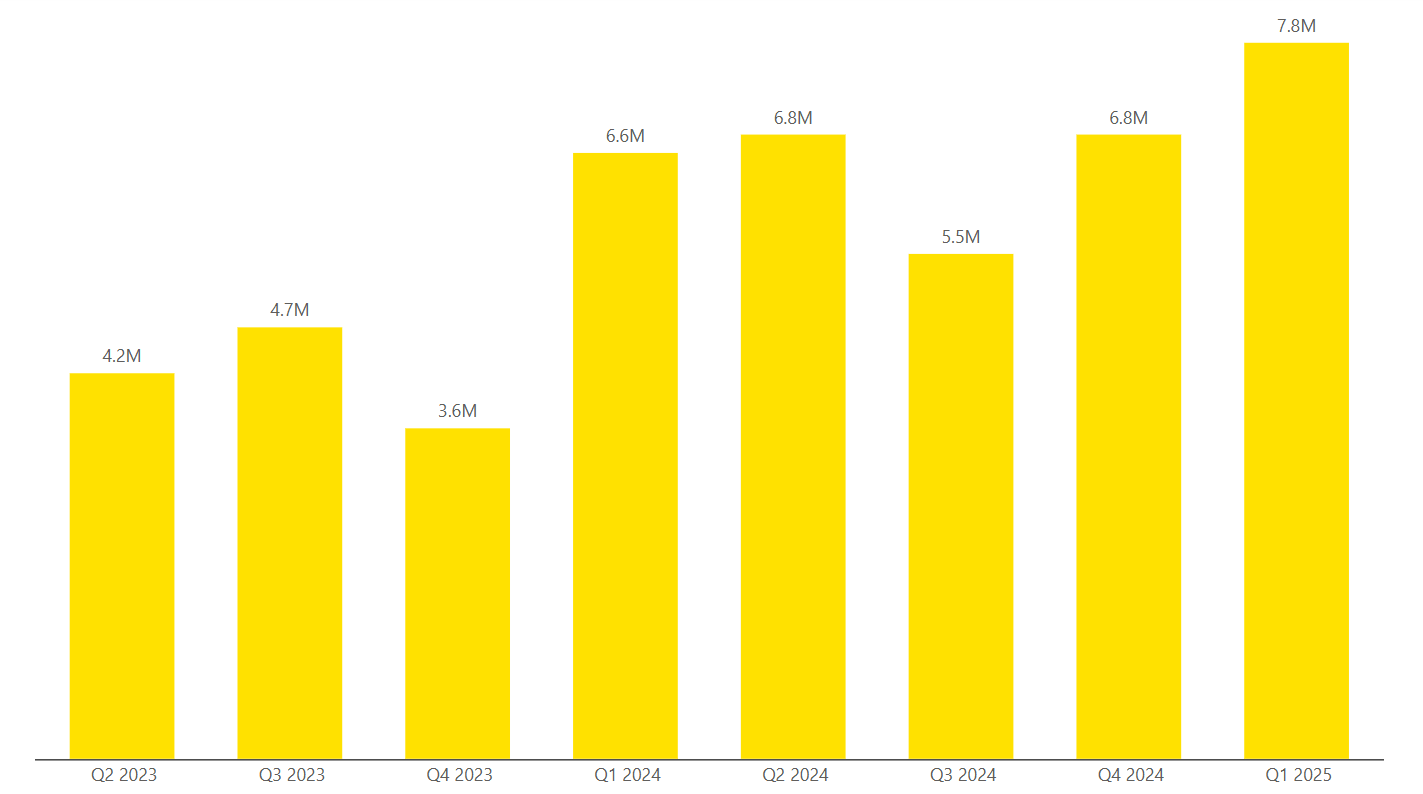
Impact: Direct Financial Loss
Direct financial losses totalled $7.8 million in Q1 2025, increasing by 14% compared to last quarter.
There were 366 incidents reported to the NCSC during Q1 2025 that reported a financial loss and specified the loss amount, this decreased by 10% from last quarter (405).
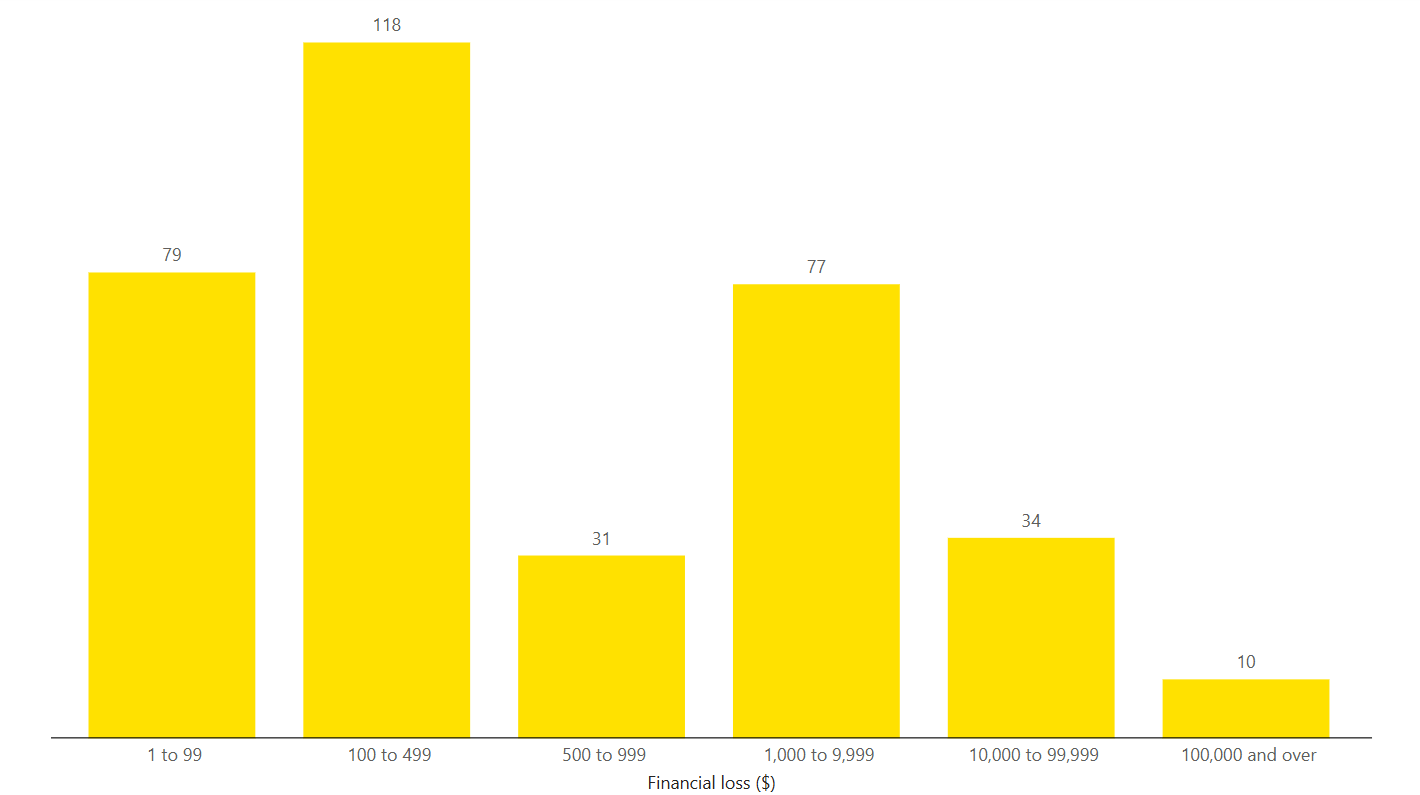
Direct financial loss breakdown:
The most common loss value reported sat between $100 to $499. Incidents $10,000 and over made up $7.4M (95%) of reported loss despite consisting of only 44 incidents.
Impact: Types of loss
As well as financial loss, the NCSC responded to incidents where other types of loss occurred.
Financial loss: 366 incidents
This includes not only money lost as a direct result of the incident, but also the cost of recovery - for example the cost of contracting IT security services or investing in new security systems following an incident. (Q4 2024: 405).
Reputational loss: 29 incidents
Damage to the reputation of an individual or organisation as a result of the incident (Q4 2024: 23)
Data loss: 73 incidents
Loss or unauthorised copying of data, business records, personal records and intellectual property (Q4 2024: 55).
Technical damage: <10 incidents
Impacts on services like email, phone systems or websites, resulting in disruption to a business or organisation (Q4 2024: <10).
Operational impacts: 19 incidents
The time, staff and resources spent on recovering from an incident, taking people away from normal business operations (Q4 2024: 12).
Other: 28 incidents
Includes types of loss not covered in the other categories (Q4 2024: 23).